Files, data and libraries
DRT 114 Computer Programming
Lesson
By the end of this module you will be able to
- Read and write CSV and JSON files with the correct UTF-8 encoding
- Use pandas to read, explore and summarise a flight log
- Detect missing values and outliers, and fix them with .loc under pandas 3 Copy-on-Write rules
- Summarise by group with groupby and plot with matplotlib
- Explain how processing choices change the answer
Why this matters
Real drone data is never clean. Sensors glitch now and then, GPS weakens near buildings, and some rows have no values. Summarising raw data straight away gives the wrong maximum altitude, distance flown or energy use, and can lead to wrong decisions. The key skill is not only calculating but checking the data before trusting it.
This module uses flight_log_sample.csv, synthetic data from a model of a 403-second survey flight, logged twice per second, with deliberate problems to find. Regenerate it with make_sample_data.py.
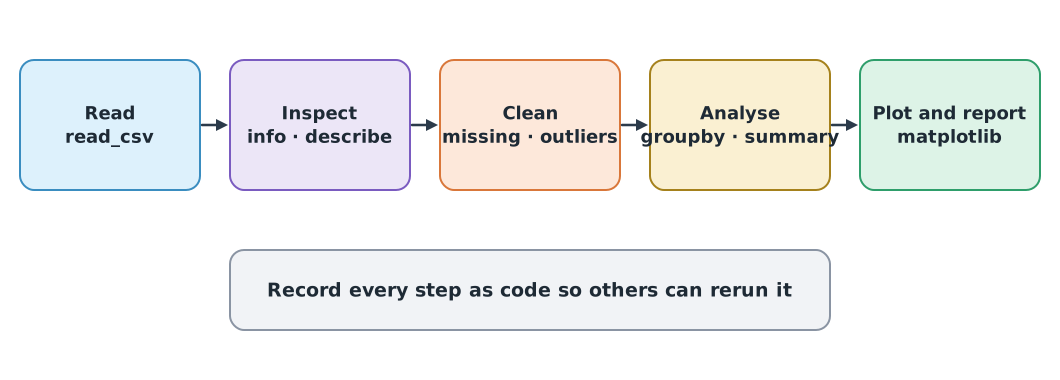
Reading and writing files
CSV and text encodings
If you do not specify an encoding, Python before 3.15 uses the machine’s locale setting, which on Thai Windows may be code page 874. A file written on one machine can then read as garbled text on another. PEP 686 makes UTF-8 the default from Python 3.15; until then, always pass encoding="utf-8", and open CSV files with newline="" as the csv module documentation requires.
import csv

with open("flight_log_sample.csv", encoding="utf-8", newline="") as f:
    rows = list(csv.DictReader(f))

print(len(rows), "rows")
print(rows[0]["t_s"], rows[0]["alt_m"], rows[0]["mode"])
print(type(rows[0]["alt_m"]))
807 rows
0.0 -0.06 GUIDED
<class 'str'>The csv module returns every value as text (str), so you must convert numbers yourself. That is one reason analysis work usually uses pandas.
JSON for summaries
JSON suits structured summaries and settings. Use ensure_ascii=False so Thai text stays readable in the file instead of becoming ส... escapes.
import json
from pathlib import Path

summary = {"flight": "สำรวจแปลง A", "rows": len(rows)}
path = Path("summary.json")
path.write_text(json.dumps(summary, ensure_ascii=False, indent=2), encoding="utf-8")

print(path.read_text(encoding="utf-8"))
print(json.loads(path.read_text(encoding="utf-8"))["flight"])
{
"flight": "สำรวจแปลง A",
"rows": 807
}
สำรวจแปลง AExploring data with pandas
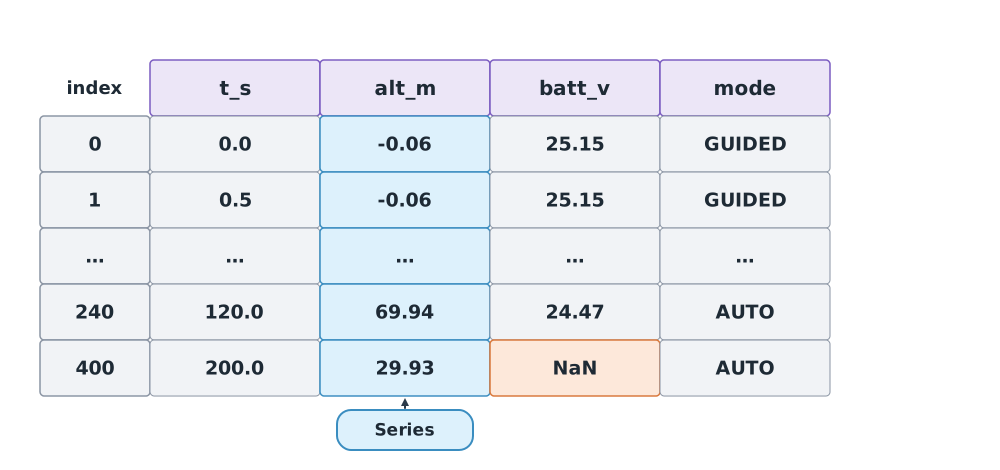
pandas holds tables as DataFrames; each column is a Series, and each row has an index label. This course uses pandas 3, which needs Python 3.11 or later.
import pandas as pd

df = pd.read_csv("flight_log_sample.csv")
print(df.shape)
print(df[["t_s", "alt_m", "batt_v", "gps_sats", "mode"]].head(3))
print(df.isna().sum()[lambda s: s > 0])
(807, 10)
t_s alt_m batt_v gps_sats mode
0 0.0 -0.06 25.15 14 GUIDED
1 0.5 -0.06 25.15 14 GUIDED
2 1.0 -0.16 25.18 14 GUIDED
batt_v 2
dtype: int64The first rows confirm the file was read correctly, and isna() shows two rows with no battery voltage. Next, look at the numbers overall.
print(df[["alt_m", "groundspeed_ms", "batt_v"]].describe().round(2)) alt_m groundspeed_ms batt_v
count 807.00 807.00 805.00
mean 28.15 7.47 24.28
std 6.76 2.77 0.27
min -0.24 0.00 23.85
25% 29.86 7.35 24.05
50% 29.97 8.85 24.27
75% 30.09 9.01 24.48
max 69.94 9.55 25.20The altitude max is 69.94 m, although the plan was 30 m and the median (50%) is about 30 m. That signals an outlier to check before reporting.
Cleaning the data
Example 1 Finding and fixing an altitude spike
Use a 5-point rolling median as each point’s reference; values more than 5 m from it are outliers. A median suits this better than a mean, because a single outlier does not drag the median with it.
df["alt_ref"] = df["alt_m"].rolling(5, center=True, min_periods=1).median()
spike = (df["alt_m"] - df["alt_ref"]).abs() > 5
print(df.loc[spike, ["t_s", "alt_m", "alt_ref"]])

df.loc[spike, "alt_m"] = df.loc[spike, "alt_ref"]
print("max altitude after cleaning:", df["alt_m"].max())
t_s alt_m alt_ref
240 120.0 69.94 30.08
max altitude after cleaning: 30.45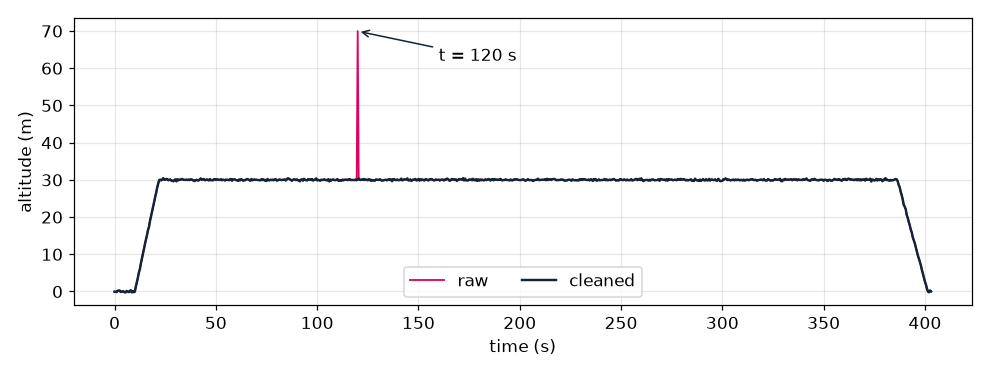
pandas 3: change values with .loc only
pandas 3 enables Copy-on-Write by default. Chained assignment such as df[spike]["alt_m"] = 0 no longer changes df (pandas warns). Always write df.loc[condition, "column"] = value in a single statement. Many books, including McKinney’s 3rd edition, predate pandas 3 and may still show the old pattern.
Missing values should not be filled by guessing. If you must fill them, state the method, such as interpolating between neighbours with interpolate(), and record how many rows were filled.
Summarising by group
groupby splits data by the values of one column and summarises each group. Rows are 0.5 s apart, so the number of rows times 0.5 is the time spent in each mode.
per_mode = df.groupby("mode").agg(
    samples=("t_s", "size"),
    mean_speed_ms=("groundspeed_ms", "mean"),
)
per_mode["minutes"] = per_mode["samples"] * 0.5 / 60
print(per_mode.round(2).sort_values("minutes", ascending=False))
samples mean_speed_ms minutes
mode
AUTO 659 8.24 5.49
RTL 70 8.50 0.58
GUIDED 44 0.00 0.37
LAND 34 0.00 0.28Method changes the answer
Example 2 How far did this flight go?
Sum the haversine distances between neighbouring GPS fixes (module 2), written in vectorised NumPy so the whole column is computed at once, and compare several methods. Inside the function, convert inputs to NumPy arrays with np.asarray() first: slicing a pandas Series directly makes pandas align data by index, giving wrong results or an error (this bug really happened while this lesson was written).
import numpy as np


def path_length_m(lat_deg, lon_deg, radius=6_371_000.0):
    """Sum of haversine distances between consecutive points."""
    lat = np.radians(np.asarray(lat_deg, dtype=float))
    lon = np.radians(np.asarray(lon_deg, dtype=float))
    a = np.sin(np.diff(lat) / 2) ** 2 + np.cos(lat[:-1]) * np.cos(lat[1:]) * np.sin(np.diff(lon) / 2) ** 2
    return float((2 * radius * np.arcsin(np.sqrt(a))).sum())


print(f"raw fixes:       {path_length_m(df['lat_deg'], df['lon_deg']):.0f} m")

weak = df["gps_sats"] < 10
fixed = df[["lat_deg", "lon_deg"]].copy()
fixed.loc[weak, ["lat_deg", "lon_deg"]] = np.nan
fixed = fixed.interpolate()
print(f"weak GPS filled: {path_length_m(fixed['lat_deg'], fixed['lon_deg']):.0f} m  ({weak.sum()} fixes)")

for window in (3, 5, 9):
    smooth = fixed.rolling(window, center=True, min_periods=1).mean()
    print(f"smoothed ({window}):    {path_length_m(smooth['lat_deg'], smooth['lon_deg']):.0f} m")
raw fixes: 3092 m
weak GPS filled: 3067 m (10 fixes)
smoothed (3): 3014 m
smoothed (5): 2991 m
smoothed (9): 2951 mThe model’s planned route is 3 015 m. The raw data overestimates it, because noise makes positions zigzag, most of all during the 10 weak-GPS fixes. Smoothing helps, but a window that is too wide cuts corners at turns and underestimates.
No method is always right. The rule is report the method with every result, and check against a known value. Real work may have no true path to compare with, but you can still compare with the flight plan or with another sensor.
Plotting
matplotlib is Python’s basic plotting library. Save a plot with savefig() to use it in a report. Figure 3 was made with the same code.
import matplotlib.pyplot as plt

fig, ax = plt.subplots(figsize=(9, 3.4))
ax.plot(df["t_s"], df["alt_m"], label="cleaned")
ax.set_xlabel("time (s)")
ax.set_ylabel("altitude (m)")
ax.grid(alpha=0.3)
ax.legend()
fig.tight_layout()
fig.savefig("altitude.png", dpi=110)
print("saved altitude.png")
saved altitude.pngModule lab
Lab: a flight-data quality report
Work in Jupyter Notebook with flight_log_sample.csv.
- Read the file; check for missing values, altitude outliers and periods with fewer than 10 GPS satellites; report them in a table.
- Clean with
.locand comparedescribe()before and after. - Summarise time and mean speed per flight mode, and find when the battery first drops to 90%.
- Calculate the distance flown by at least two methods, and explain which you chose and why.
- Plot altitude and battery voltage against time, and hand in a notebook that gives the same results when rerun from the start.
Common mistakes
Watch out
- Not passing
encoding="utf-8", so Thai text is garbled on other machines - Reporting max or min from raw data without checking for outliers
- Using chained assignment, which does nothing in pandas 3
- Silently dropping problem rows without recording how many and why
- Over-smoothing until real detail is lost
- Editing the original data file instead of keeping it and saving results to a new file
Summary
- Pass
encoding="utf-8"whenever reading or writing text files, andensure_ascii=Falsefor JSON containing Thai - pandas explores and summarises data with
read_csv,head,isna,describeandgroupby - A rolling median finds outliers; in pandas 3, change values with
.loc - Processing methods change the answer, so report the method with the result
- Save plots with
savefig()and keep notebooks reproducible
Check your understanding
- Why pass
encoding="utf-8"when opening a file in Python 3.14 on Thai Windows? - What type does the csv module return for the
alt_mcolumn? - Why use a rolling median rather than a rolling mean to find a spike?
- Write the pandas 3 statement that sets
batt_vto 0 only wheremodeis"LAND". - Data is logged every 0.5 s and has 70 rows in RTL mode. How many seconds was it in that mode?
Answers
- Before Python 3.15 the default depends on the machine’s locale, which may be code page 874 rather than UTF-8, so the file may be misread
str(text); you must convert it to a number yourself- A single outlier pulls the mean, but hardly changes the median
df.loc[df["mode"] == "LAND", "batt_v"] = 0- s
Key formulas
| Rolling median (5-point window) | |
| Total distance from GPS fixes |
Key references
- Python Software Foundation. The Python tutorial (Python 3.14 documentation). link
- Inada, N. (2022). PEP 686 – Make UTF-8 mode default. link
- The pandas development team. (2026). What’s new in 3.0.0. pandas documentation. link
- The Matplotlib development team. Matplotlib documentation (3.11). link
- McKinney, W. (2022). Python for data analysis (3rd ed.). O'Reilly.
- Downey, A. B. (2024). Think Python: How to think like a computer scientist (3rd ed.). O’Reilly. link
Further reading
Study the assigned knowledge units in advance, review media and take the module quiz
Python programming for technology work
Data handling and visualisation with Python
In class / field
Lab or field practice from worksheets with a safety checklist
Learning evidence: Checked worksheets and quiz results